INDUSTRY:
Consumer Services
CLIENT:
McDonald's
YEAR:
2022
EXPERIENCE:
Ux Case Study

McDonald's BRE Portal
1. about.
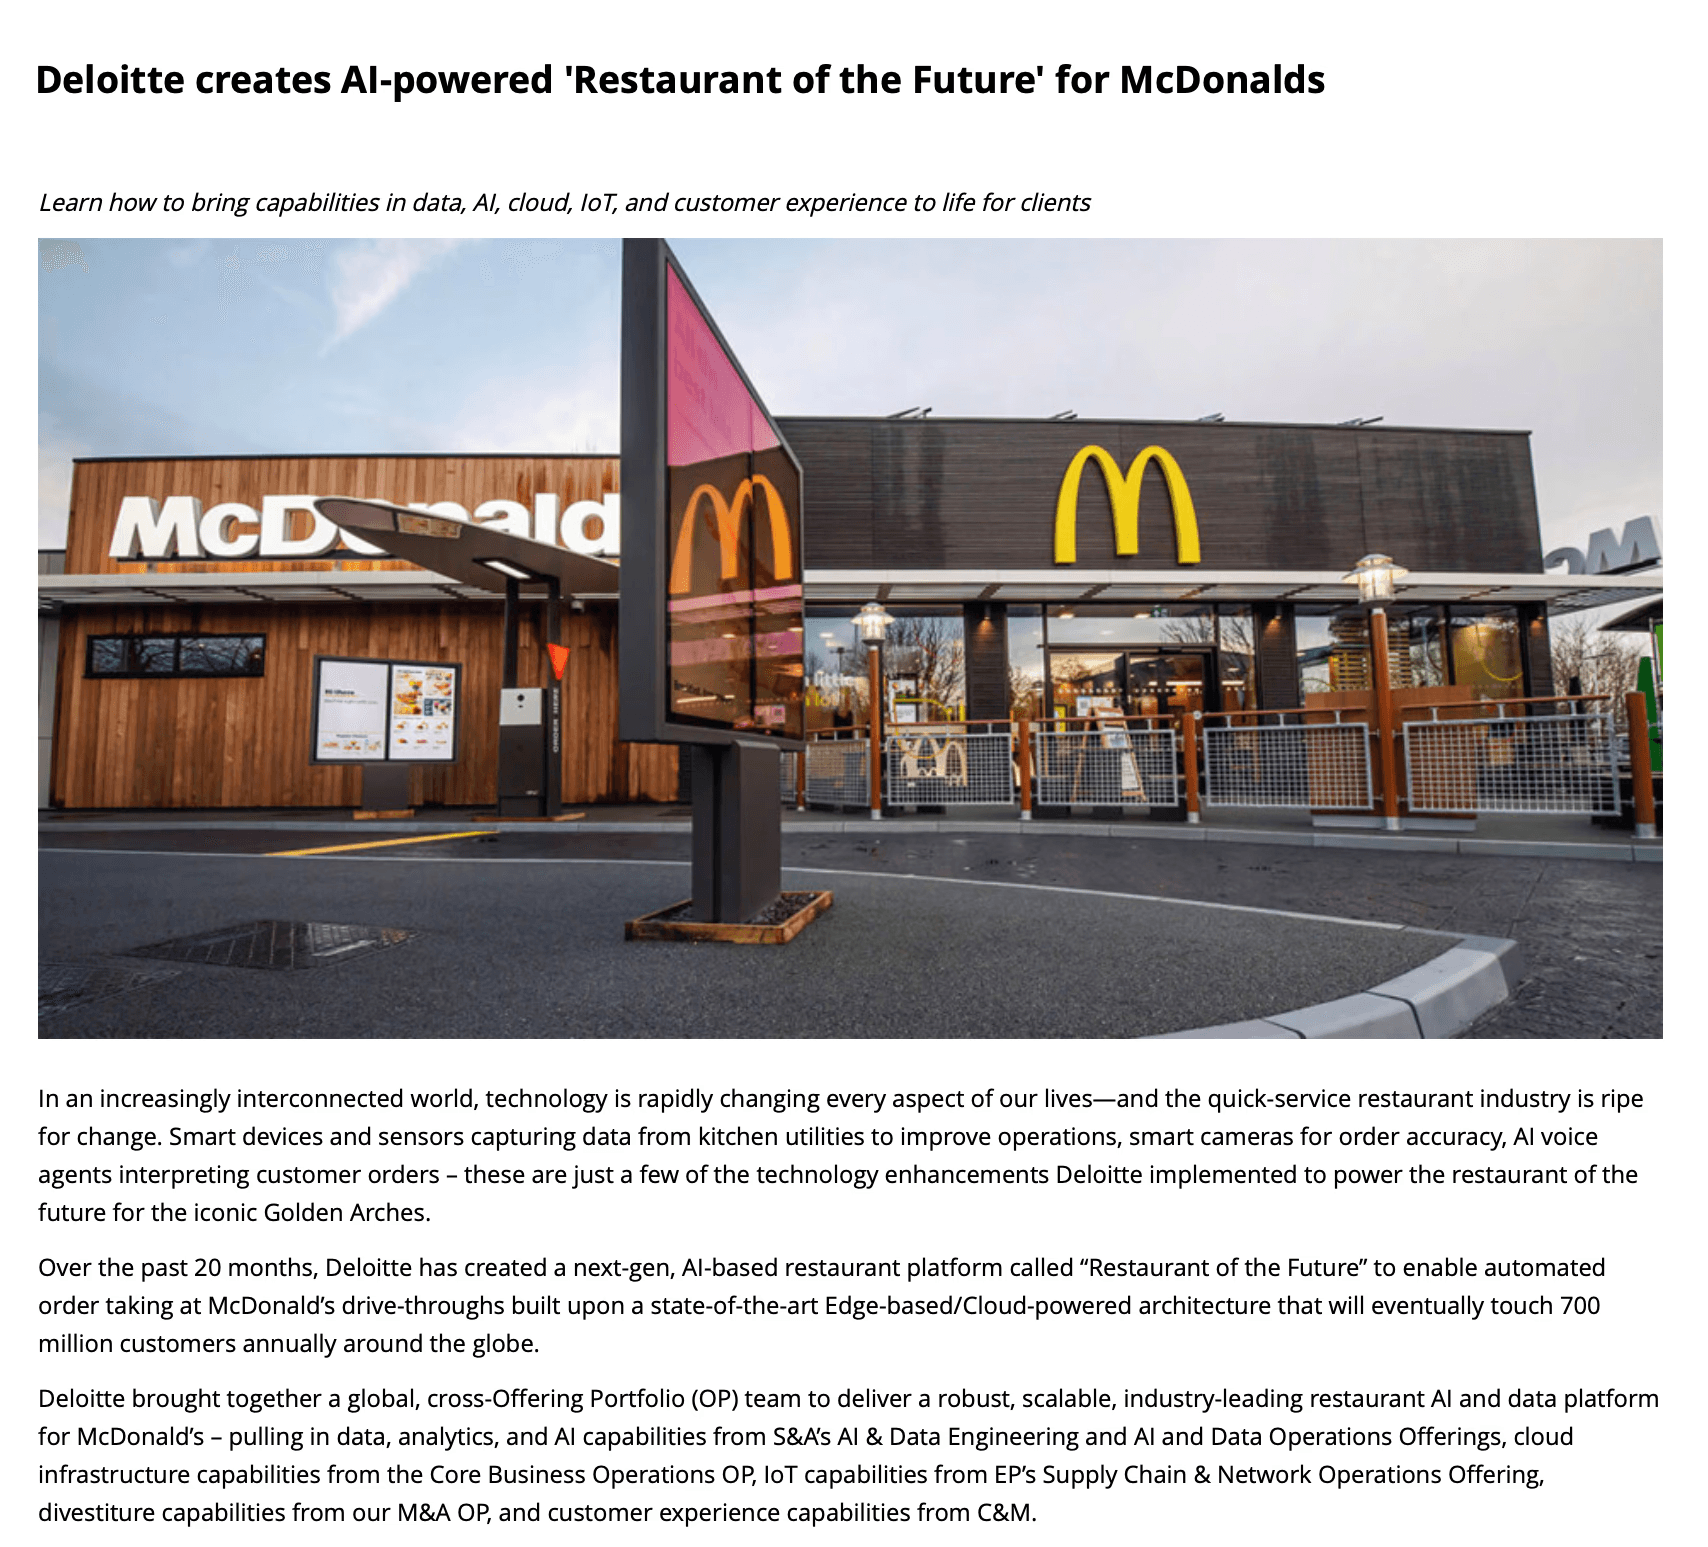
"In an increasingly interconnected world, Deloitte built a next-gen, AI-based restaurant platform — the 'Restaurant of the Future' — to enable automated order taking at McDonald's drive-throughs, eventually touching 700 million customers annually."
B2B Internal Portal Deployment Module 2 months UX Design
WHAT IS BRE?
Breakthrough Restaurant Efficiency (BRE) is an internal B2B platform built by Deloitte for McDonald's, enabling deployment specialists and SREs to push, validate, and roll back software to edge clusters installed across 96+ drive-thru locations worldwide.
Every McDonald's drive-thru customer interacts with AI — voice agents take orders, cameras detect vehicles, digital boards update menus in real time. None of that works without the software running on edge clusters at each restaurant. BRE is the platform that gets that software there — reliably, safely, and at scale.
I didn't design a deployment tool. I designed the infrastructure that delivers AI to 96 restaurants.

Voice AI | Vision AI | Edge AI |
|---|---|---|
AI-powered voice agents take customer orders in drive-thru lanes. This platform deploys and validates the models that run them. | IoT cameras use computer vision for vehicle detection and order tracking. BRE manages the full software lifecycle for these edge AI devices. | All AI inference runs on-device at the store — not in the cloud. This platform is the only delivery system for getting models to the edge. |
Every AI-powered interaction a McDonald's customer has in drive-thru is only possible because this BRE deployment platform works flawlessly.
PROBLEM STATEMENT.
The deployment process was fragile, slow, and high-risk.
Before GitOps v3, deploying software to drive-thru stores was a high-pressure, manual operation. Any mistake during a live release could take a restaurant offline mid-service.
Core question: How do we make deployments fast, safe, and observable — at 96 stores simultaneously?
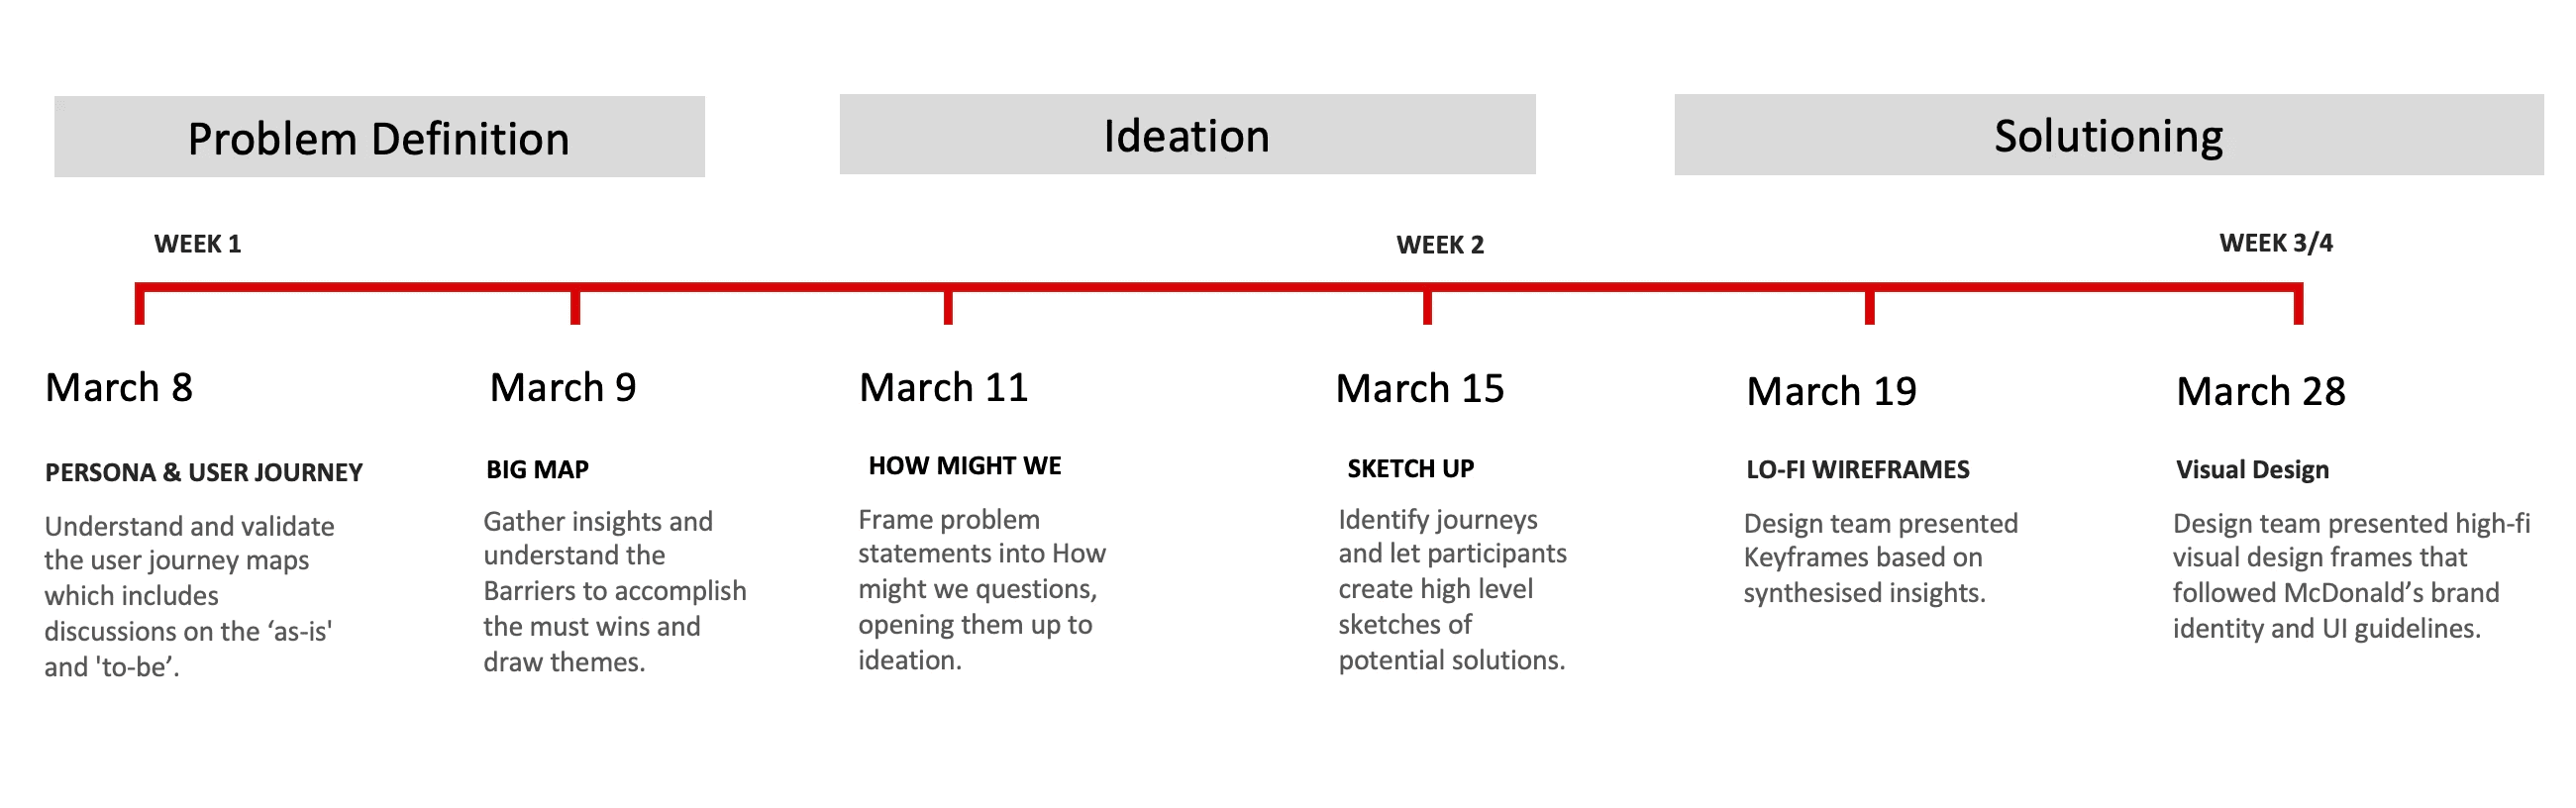
DESIGN PROCESS.

2. research.
The real problem wasn't technical complexity.
"We assumed users were struggling with the volume of deployments. Research showed the real problem was trust — operators couldn't see what was happening, so they couldn't act with confidence."
Every pain point traced back to the same root cause: a system that gave users no visibility, no control signals, and no recovery safety net. When something went wrong across 96 restaurants, there was no single place to look — and no fast way to fix it.
CORE RESEARCH INSIGHT.
"The deployment process wasn't just slow — it was invisible. Operators were flying blind across 96 restaurants with no dashboard, no alerts, and no undo button."
Surfaced through journey mapping with users, confirmed in Big Map sessions with product owners/business stakeholders, and reinforced in every 'How might we' exercise — the top two voted questions were about visibility and recovery speed.
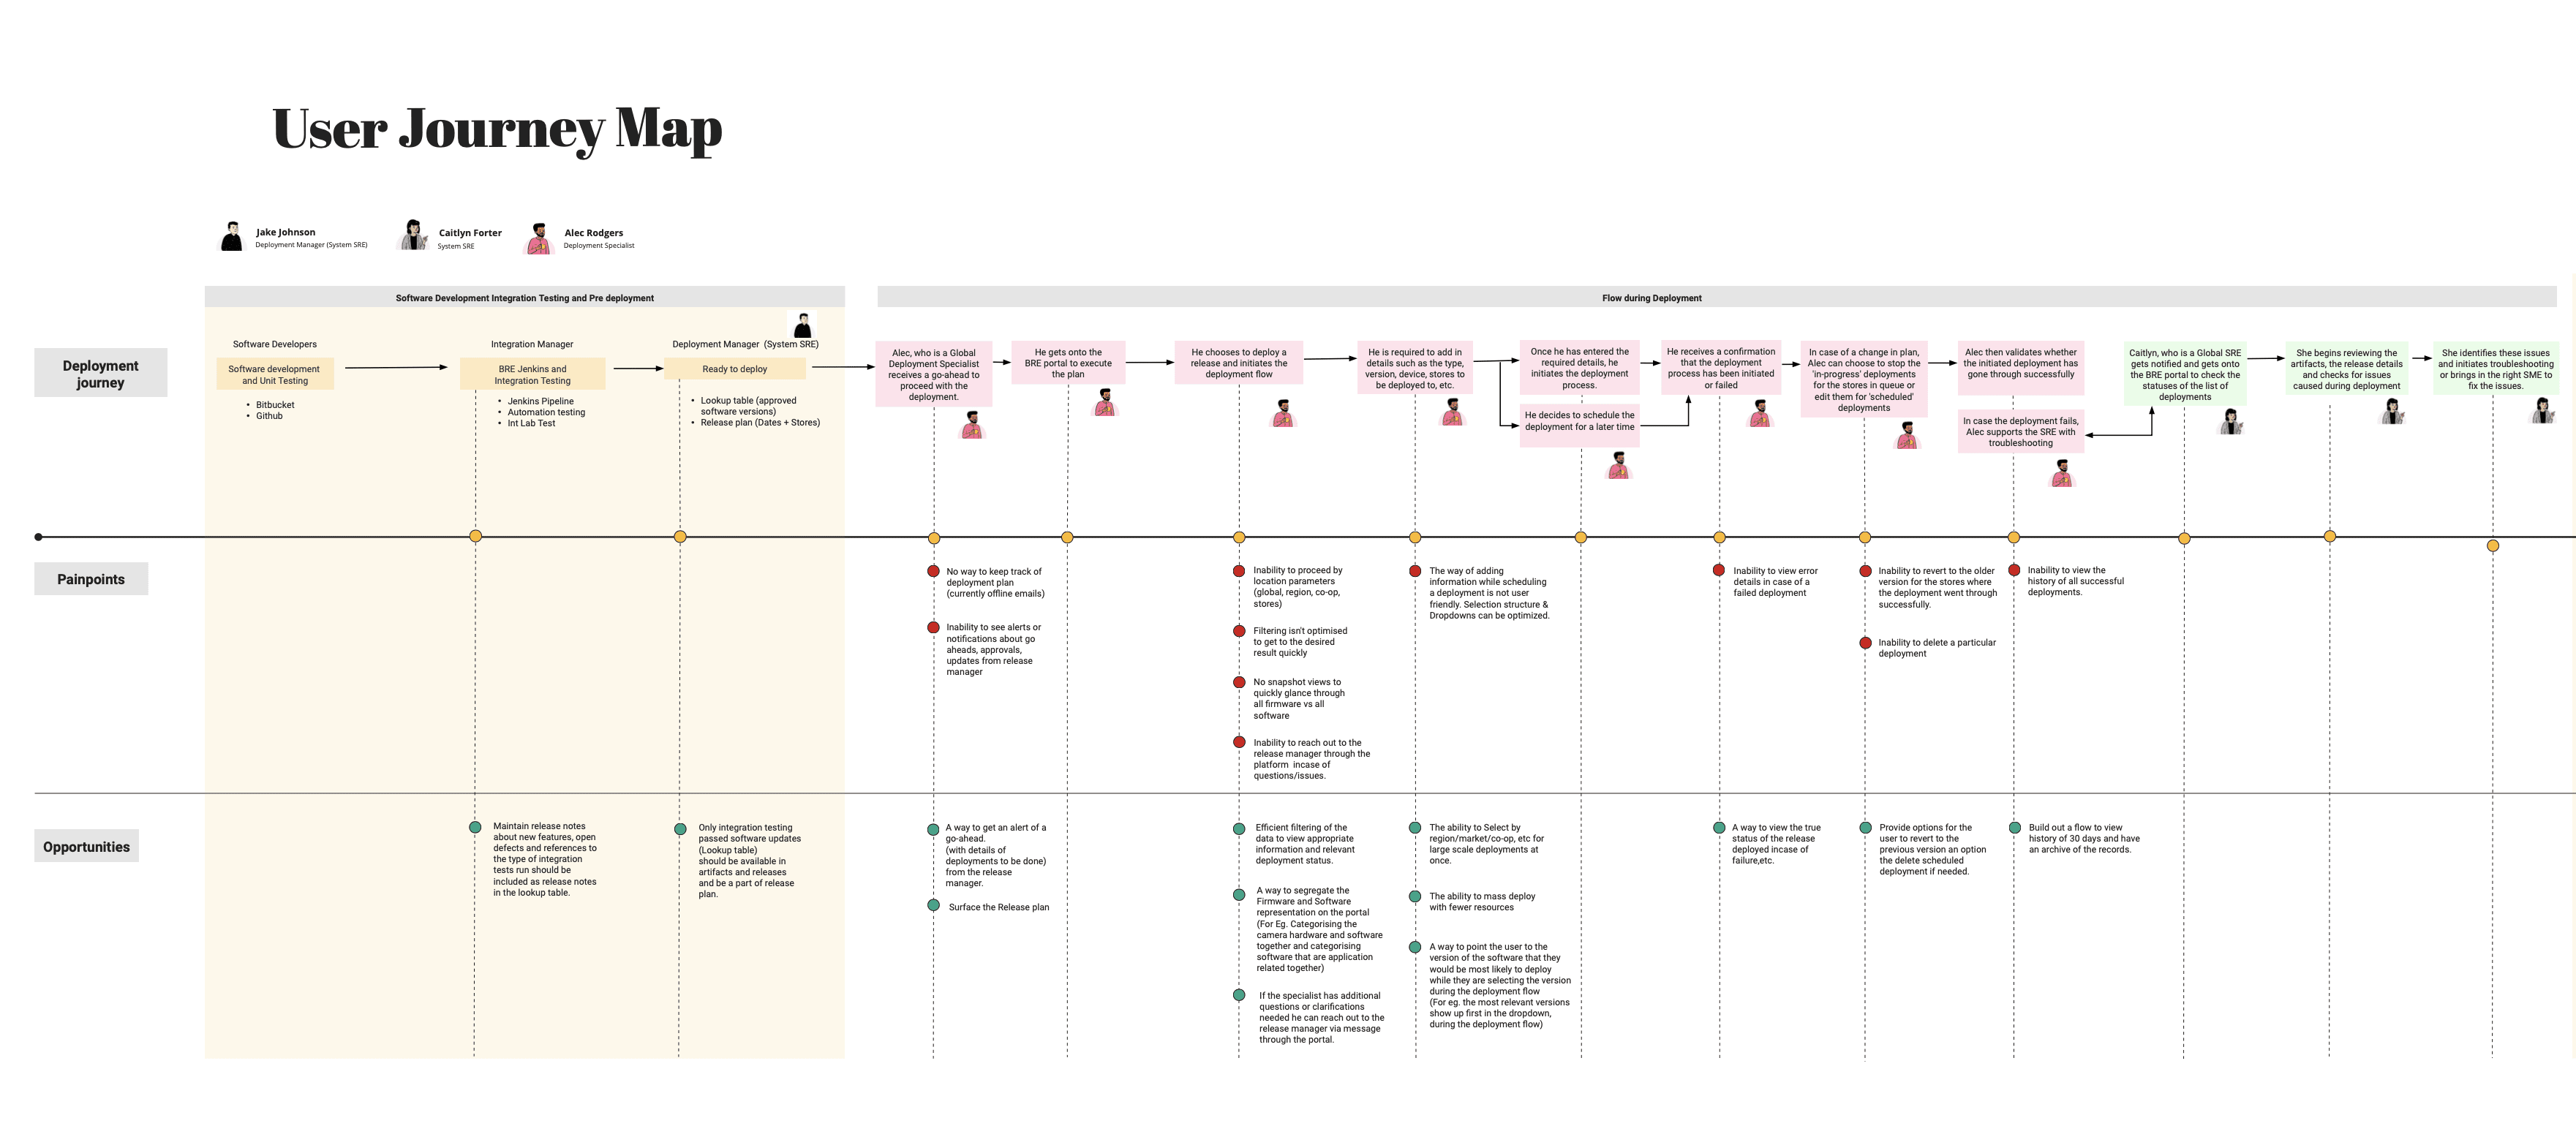
WHAT JOURNEY MAPPING REVEALED — SPECIFIC PAIN POINTS FROM USER SESSIONS
Big Map question posed to users: "What are the potential barriers that would prevent us from seamlessly executing the deployment flow across 100 stores by June 2023?"
No way to keep track of deployment plan status — users relied on offline emails
Inability to see alerts or notifications about go-aheads from release manager
Inability to proceed by location parameters (global, region, co-op, stores)
Filtering not optimised to get to desired results quickly
No snapshot view to glance through all firmware vs all software
No way to view error details in case of a failed deployment
Cannot revert to older software version for stores that successfully deployed
Cannot view history of all successful deployments over past 90 days
5 CHALLENGE — EACH ROOTED IN THE RESEARCH
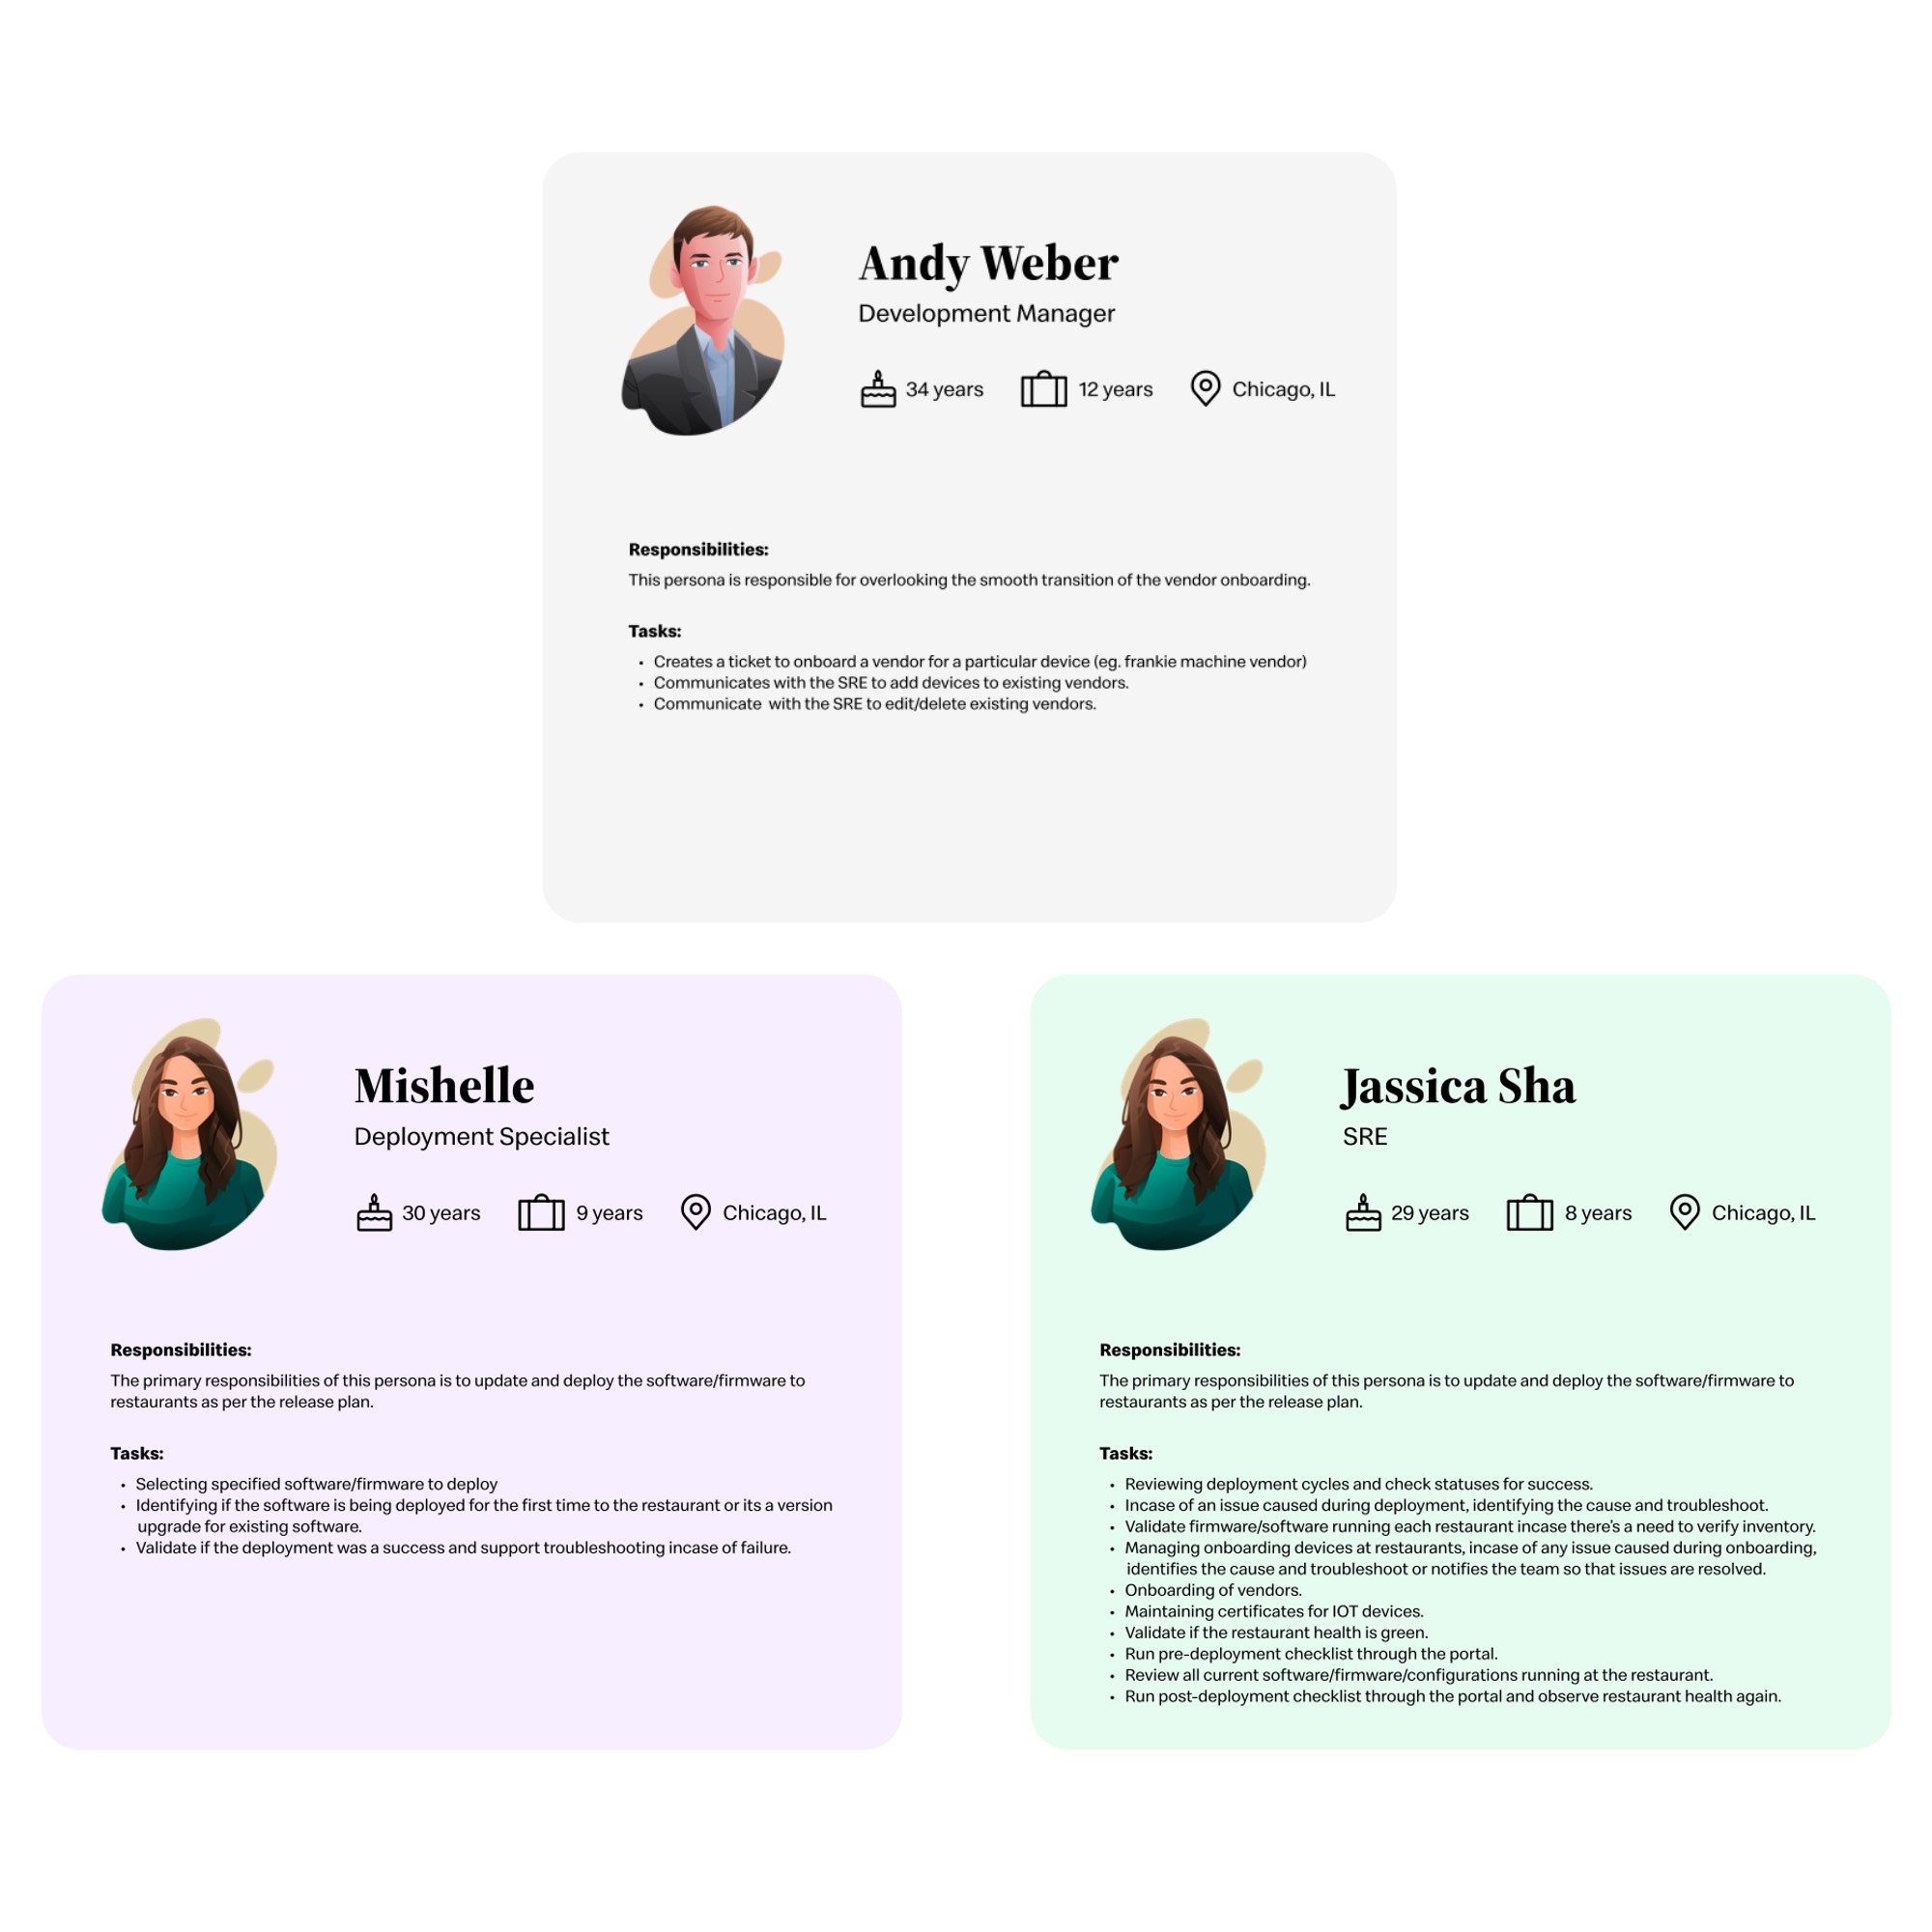
01 | No unified place to initiate, track or complete a deployment"User-Mishelle(Deployment specialist) had to juggle CLI commands, runbooks, and Slack messages just to start a release — before anything had even gone wrong yet."
|
02 | No visibility into what's happening across 96 restaurants simultaneously"When a deployment was running, nobody had a single view of which stores had succeeded, which were in-progress, and which had failed. Status updates happened over Slack."
|
03 | Selecting and configuring stores required too many manual steps"Deploying to "specific stores in the Chicago region" required manually listing every store. There was no hierarchy-based selection, no multi-select, no smart filtering — at 96 stores, this was untenable."
|
04 | Rollback required repeating the entire deployment — no fast recovery path"Jassica's worst fear: a deployment fails at midnight, and the only way to fix it is starting the full process over again. There was no "undo". Recovery was as slow as the original deployment."
|
05 | No IT health view per restaurant — problems were always discovered too late"If Voice Agent went unhealthy at Restaurant 047 in Chicago, there was no single screen that showed this. Jassica(SRE) would find out when the restaurant called — not from a dashboard."
|


3. What we built — and why each decision was made.
Deployment Flow
4-step guided deployment — in seconds
A complex ops process redesigned into a single guided workflow. Name the release → Select applications → Select stores by hierarchy → Confirm & deploy. No runbook needed.
Select stores by region / market / co-op / restaurant
Multi-select applications and versions in one step
Confirmation summary screen before any commitment
Bundle release — multiple software & applications at once
Deployment queue with live progress per deployment
Impact: A complex ops process redesigned into a workflow any specialist can complete confidently - without a runbook in hand. Reduced deployment time by 95%
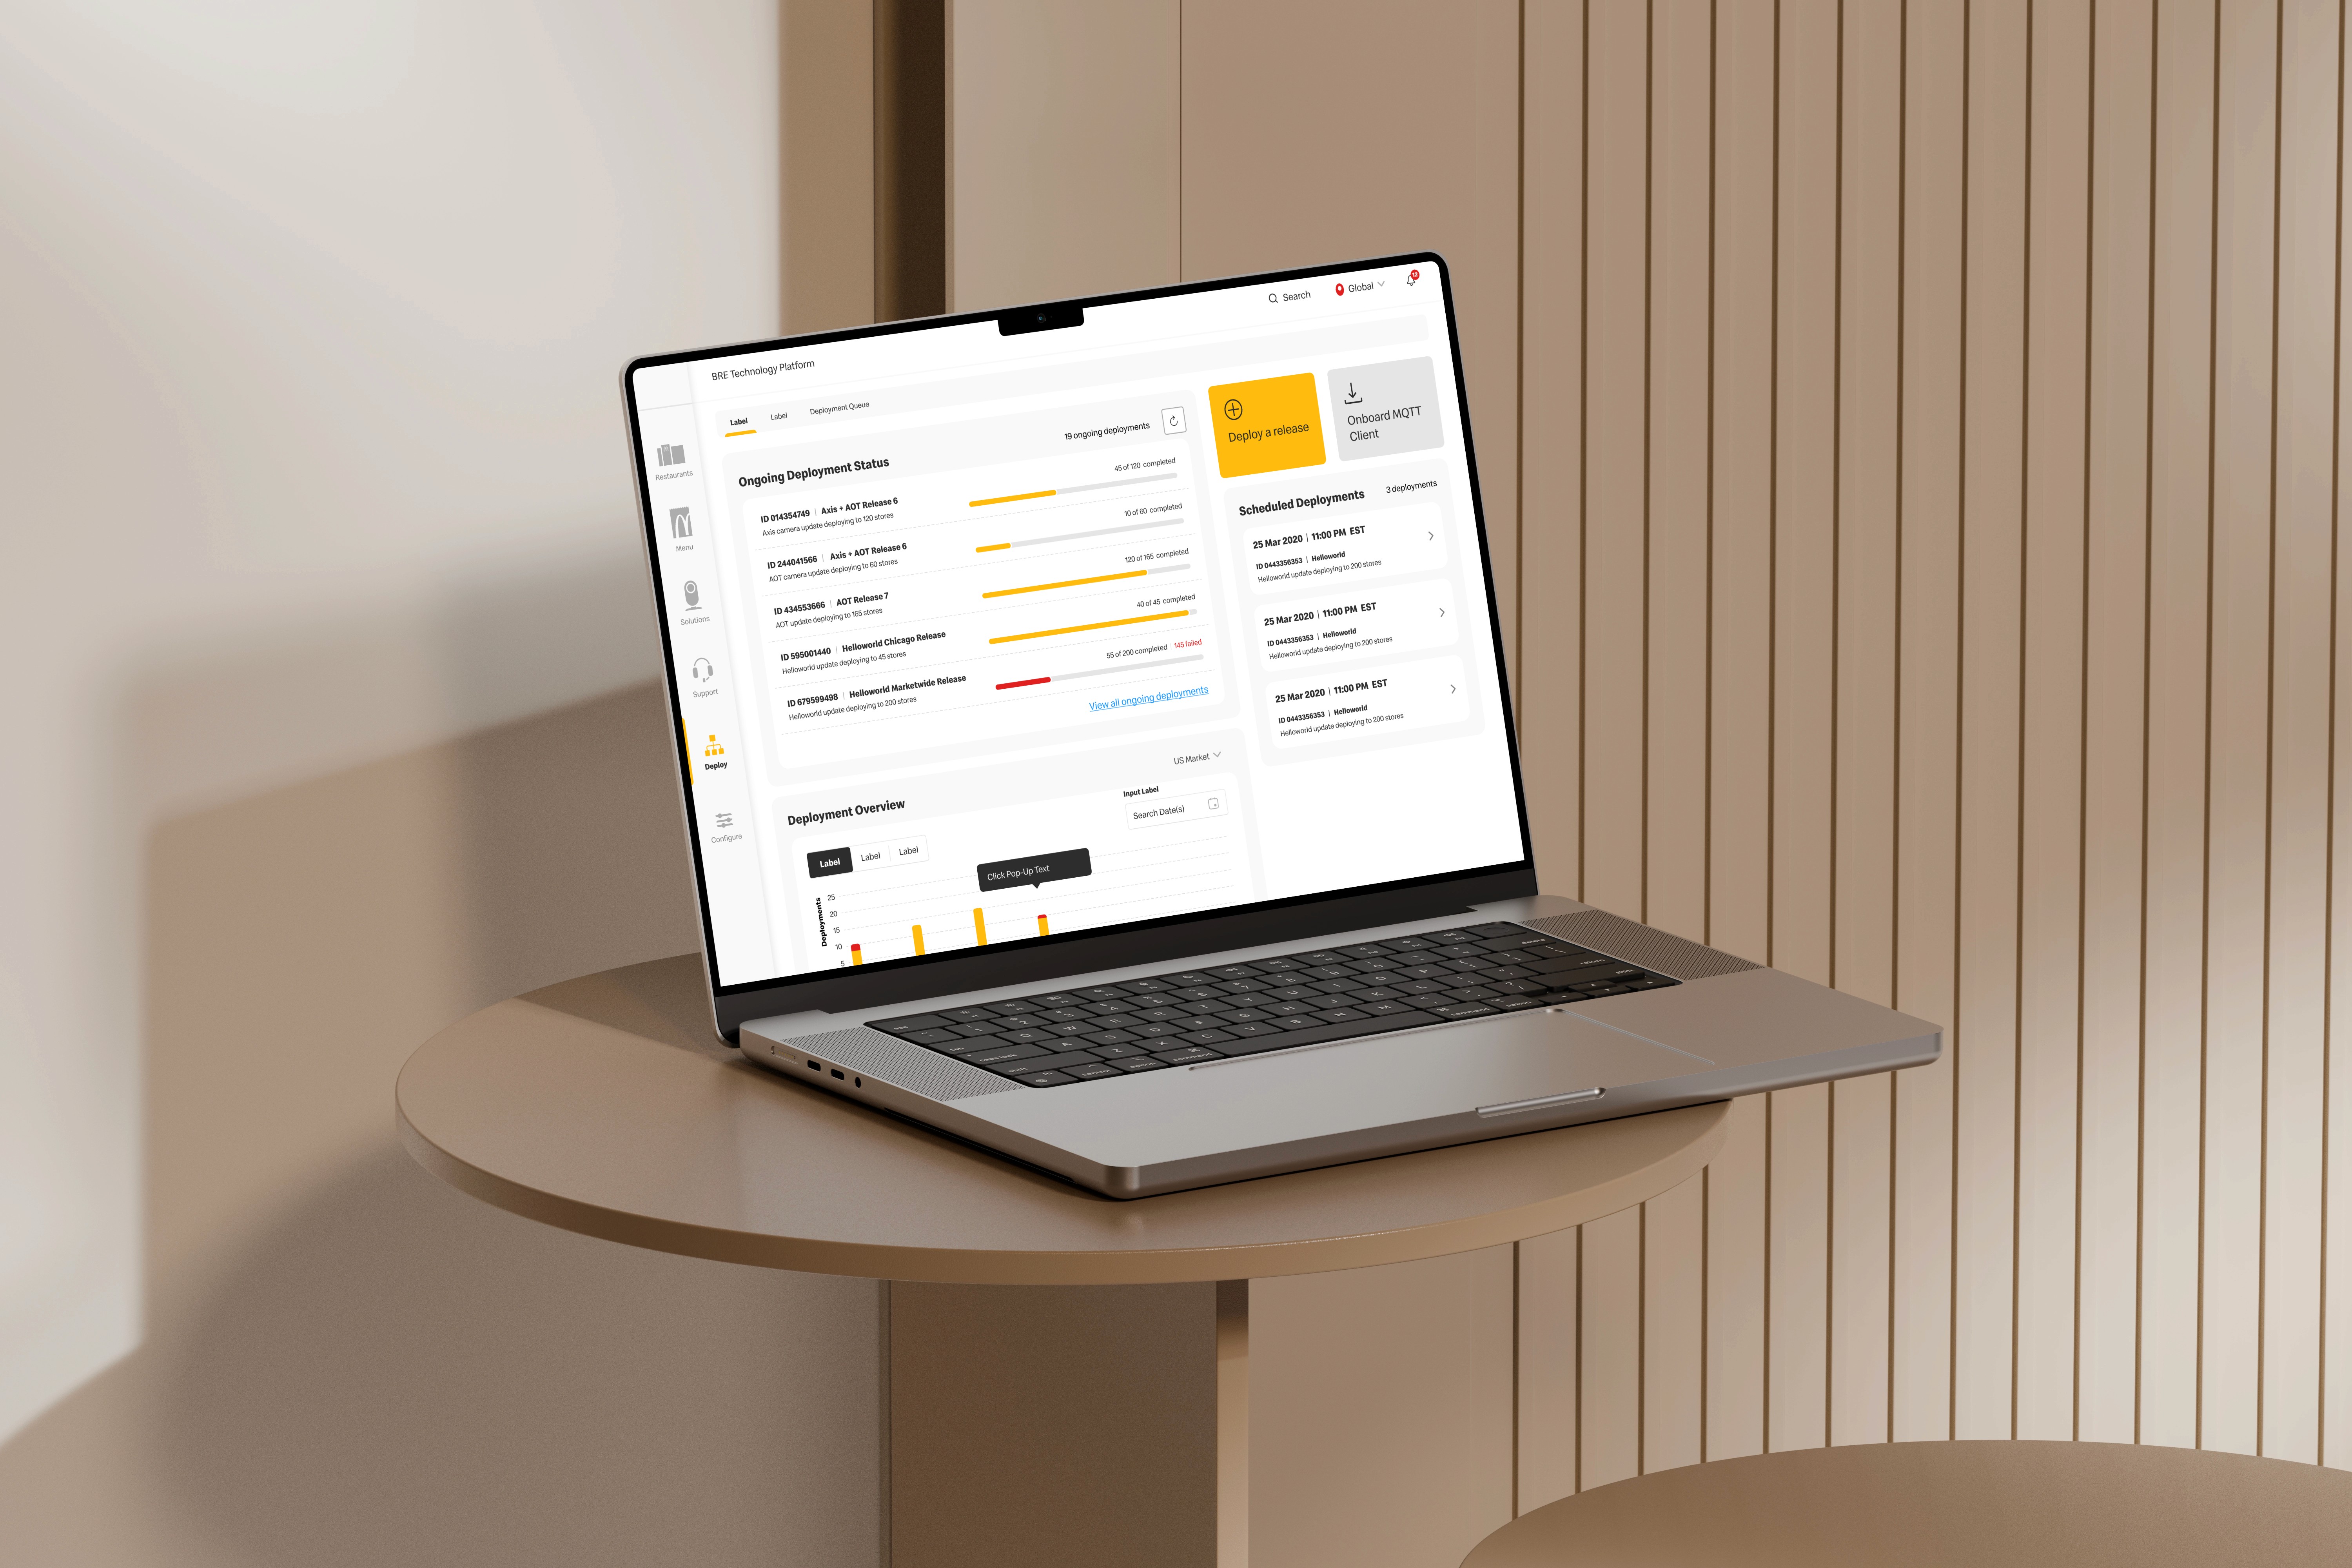
Landing Page - Deployment Dashboard · Transparency
Live visibility for every restaurant, on one screen
The home dashboard replaced scattered Slack updates with real-time deployment status across all 96 locations. Role-based views ensure each user sees what matters to them.
Personalised views: read-only for some roles, edit access for others
Alert mechanism: approvals, confirmations, failed deployments
Deployment Overview: 22 total · 92% success rate · 8% failure rate
Scheduled and ongoing deployments visible side by side
Historical trends: weekly, monthly deployment data
Unified System · Releases
All releases and artifacts in one unified view
Deployment history, active releases, artifacts, and upcoming schedules consolidated into a single system — ending the era of tribal knowledge and disconnected tooling.
Categorical groupings of software vs firmware versions
Inventory by version deployed across stores with status
Filter by National Store Number, Profile, Store Health
90-day history of successful/unsuccessful deployments
Scheduled deployment modification & delete options
Restaurant Dashboard · Health status
Full IT health visibility per restaurant
SREs and restaurant owners get a comprehensive view of every location's infrastructure — hardware health, application inventory, and a full activity log — before problems escalate.
Health status per component: AOT Hardware, Voice Agent, EVD, Audio, B&G Tech
AOT Technology snapshot: platform apps, configs, hardware, certificates
Tabulated apps/hardware/configs & certificates with pagination
Activity log: onboarding events, deployments, system changes
Restaurant details: region, address, contact, hours, IP address